Unconditional Longitiduinal Mixed-Effects Models
Fan Cost Index of Attending NHL Games
This project assessed the longitudinal variation in the cost of attending an NHL game from 2002-2014 by using the metric Fan Cost Index (FCI) (no data from 2012 due to lockout). FCI is an index used to determine the cost of attendance to a sporting event for a family of four. It is calculated by summing the prices of four average-price tickets, two small draft beers, four small soft drinks, four regular-size hot dogs, parking for one car, two game programs, and two least-expensive, adult-size adjustable caps, for a season. Data was collected from all 30 teams that were in the NHL during this time period.
Investigating the Relationship
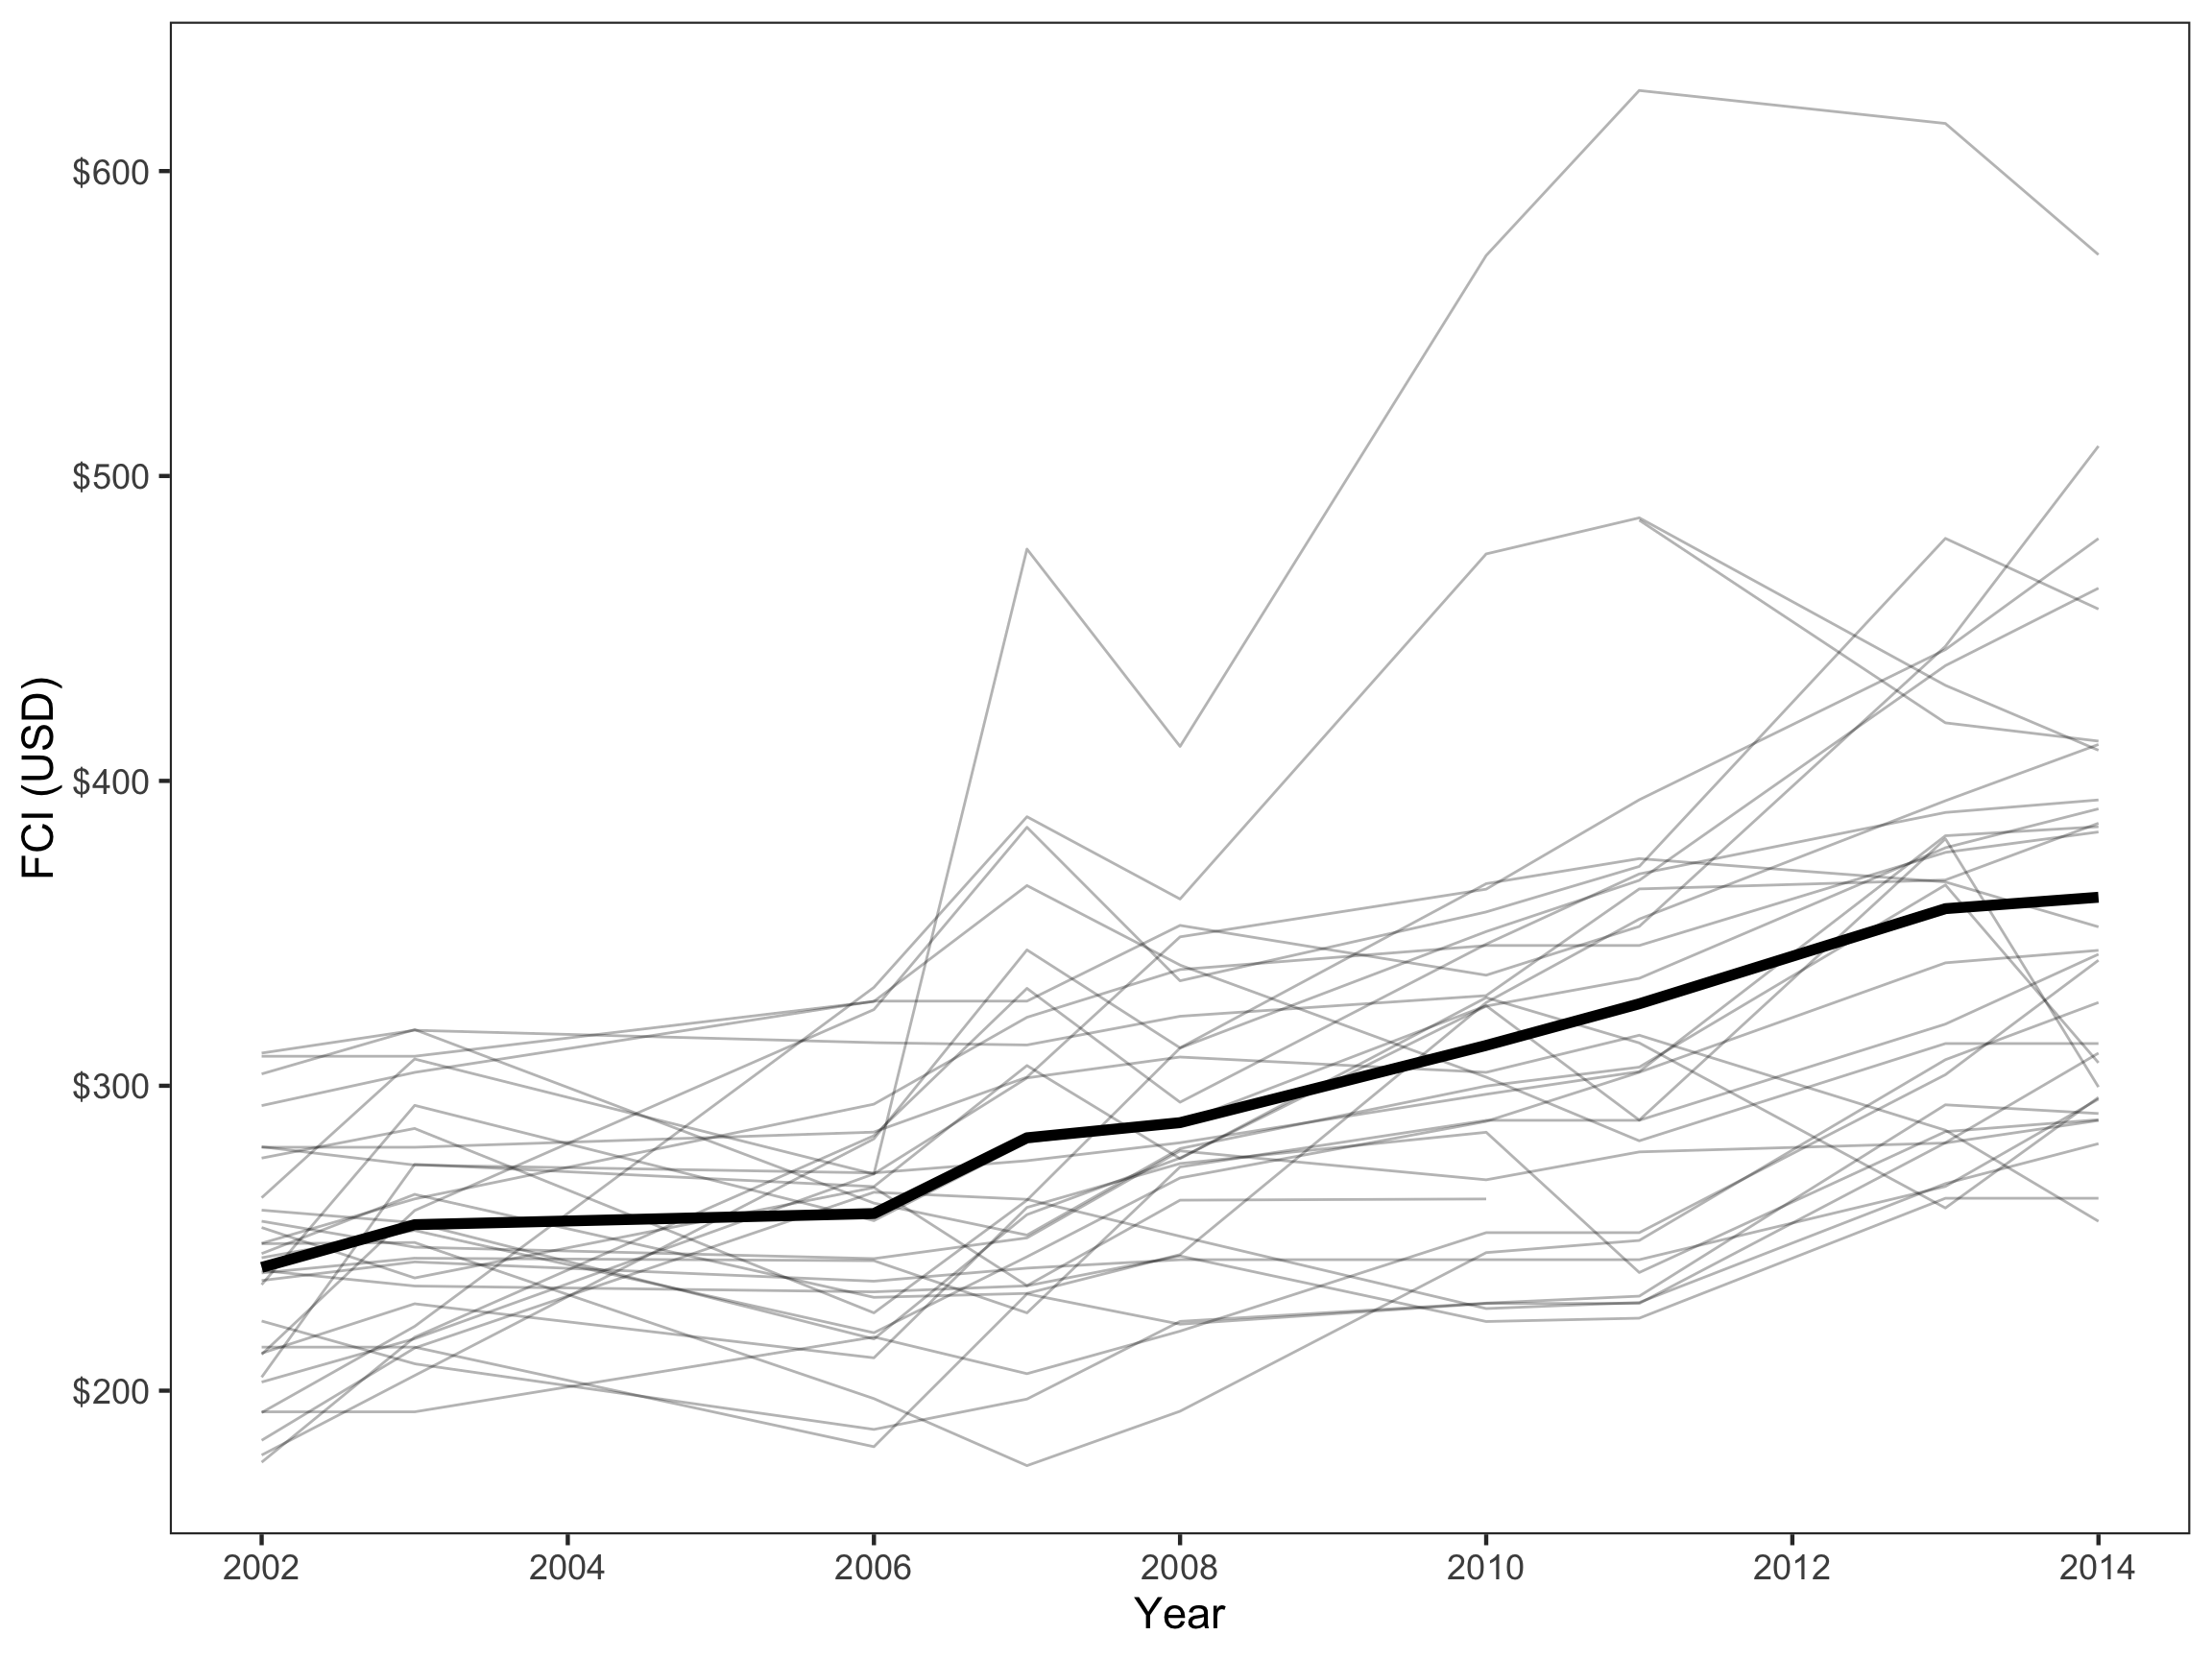
A spaghetti plot was created to understand how the NHL and each team’s FCI has changed from the 2002 to 2014. Individuals teams are represented by thin, gray lines, while the average growth trend line for the entire NHL is displayed in bold.
The average growth trend line for the NHL is positive and appears to be linear, although there may be evidence that suggests there is a quadratic relationship between FCI and year.
Creating and Comparing Models
Three mixed-effects models were considered in this analysis: a) an unconditional random intercepts model (to get a baseline measure of the unaccounted for variation); b) an unconditional linear growth model; and c) an unconditional quadratic growth model. Here is a table of the unstandardized coefficients and standard errors for these models.
Table 1. Unstandardized Coefficients and Confidence Intervals for a Series of LMER Models Fitted to Estimate FCI of NHL Games
=====================================================================================
                                  Model 1            Model 2            Model 3
Team                                                  10.138             5.205
                                                 (8.867, 11.408)     (0.847, 9.564)

Year                                                                     0.413
                                                                     (0.064, 0.763)

Year(Squared)                     299.881            236.580            244.821
                             (281.121, 318.642) (216.925, 256.235) (224.052, 265.590)

-------------------------------------------------------------------------------------
Level-2 Variance (Intercept)      2428.05            2398.24            2385.28
Level-1 Variance                  3478.38            1727.95            1691.46
AICc                              3034.34            2866.48            2863.25
=====================================================================================
Model 3 has the most empirical support for representing the data (AICc = 2385.28), although Model 2 has some support too (ΔAICc = 3.23). Below is the written equation for this model.
\[ \begin{split} \mathrm{Model~3}:~\hat{\mathrm{FCI}_{i}} &= 244.82+ 5.21(\mathrm{Year-2002}_{ij}) + 0.41(\mathrm{Year-2002}_{ij})^2 +\mathrm{b_{0j}} \end{split} \] Where \(b_{0j}\) represent a random effect on the y-intercept associated with each team.
Interpretting Model 3
The predicted average league-wide FCI for all teams at the initial measurement occasion (in 2002) is $244.82. Each subsequent year is associated with an increase of league-wide FCI by at least $5.61, and this effect of year increases over time. The variation between teams (58.50%) accounts for more variation than the variation within a team (41.50%). In other words, this means that a team’s FCI in 2002 (the y-intercept) has a larger effect on the FCI of a given year than the rate of change of that team’s FCI from 2002-2014 (Year). The random effect in this model adjusts the team’s FCI in 2002 only.
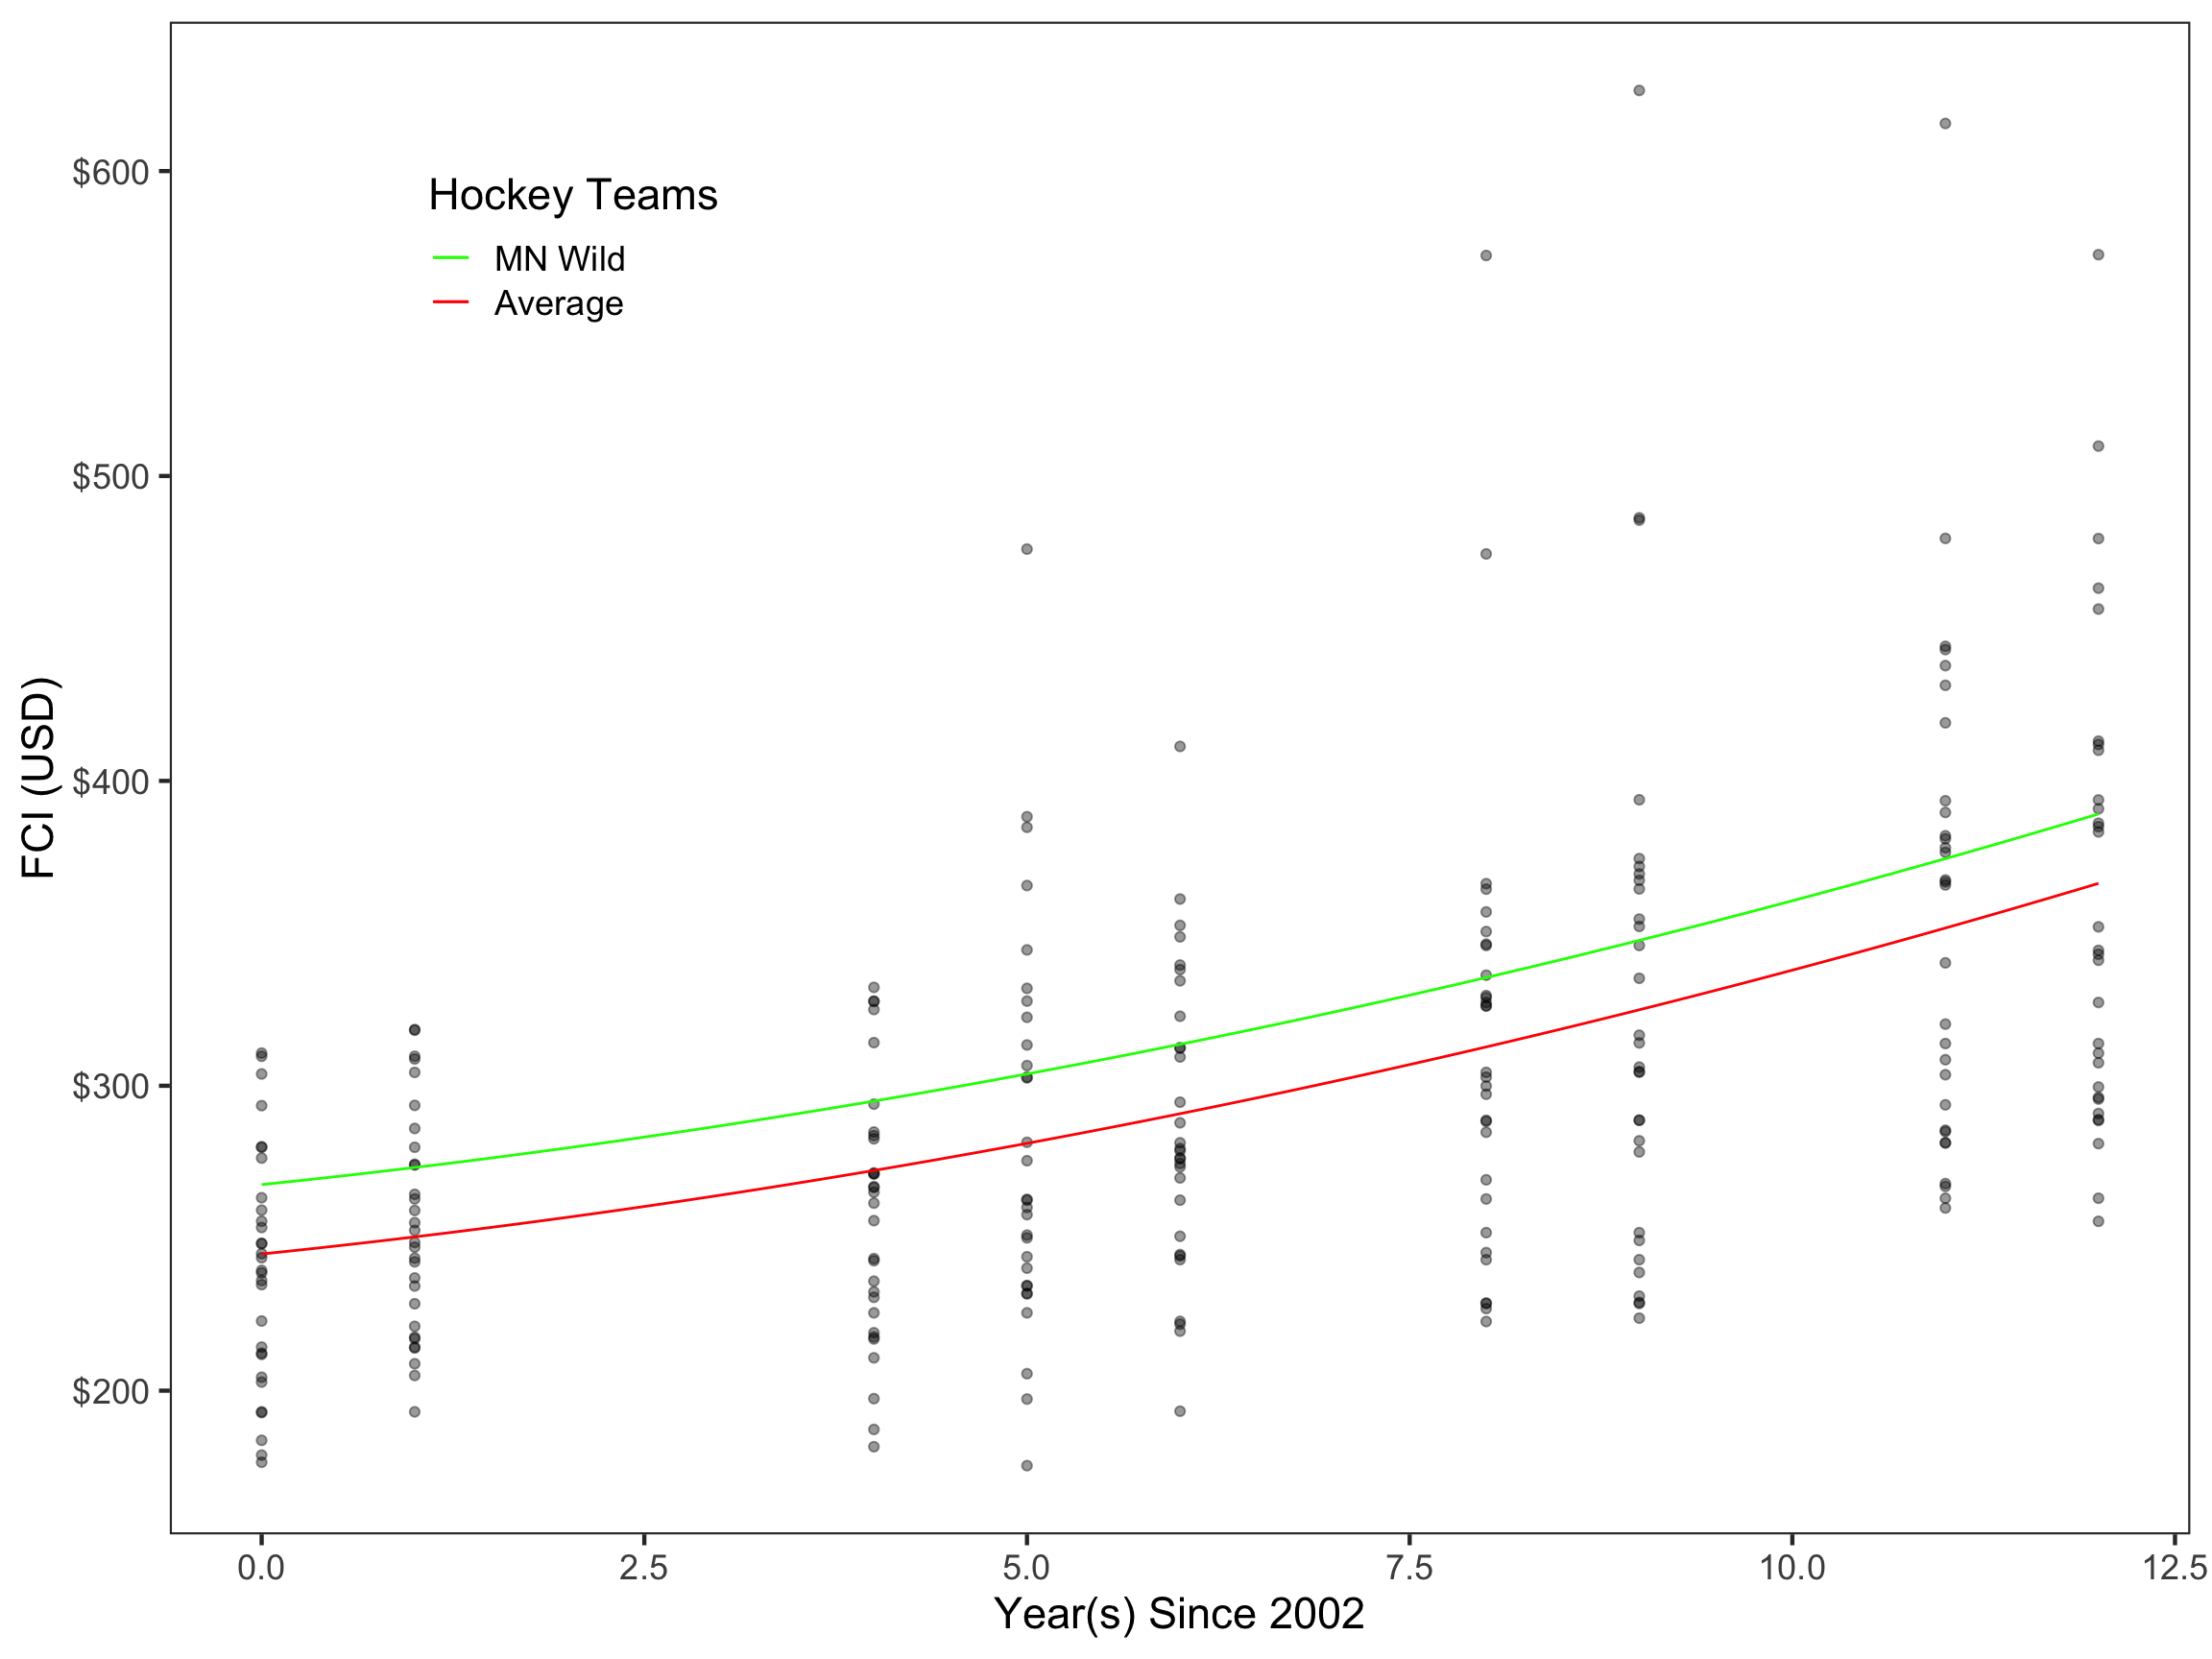
Predicted FCI of the Minnesota Wild
The Minnesota Wild was selected from the sample to demonstrate this model in use. The random effect of the Minnesota Wild’s FCI in 2002 is $22.76 (\(b_{0j} = 22.76\)), meaning that the Wild’s FCI in 2002 is $22.76 higher than the league average. This value was substituted into our initial equation, which was then simplified. These steps are shown below.
\[ \begin{split} \mathrm{FCI}_i &= \beta_{0} + \beta_{1}(\mathrm{Year-2002}_{ij}) + \beta_{2}(\mathrm{Year-2002}_{ij})^2 +\mathrm{b_{0j}} +\epsilon_{0j} \\[1em] \hat{\mathrm{FCI}_{MN}} &= 244.82+5.21(\mathrm{Year-2002}_{MNj}) + 0.41(\mathrm{Year-2002}_{MNj})^2 +22.76 \\[1em] &= 267.58+5.21(\mathrm{Year-2002}_{MNj}) + 0.41(\mathrm{Year-2002}_{MNj})^2 \end{split} \]
This predictive equation for the Minnesota Wild was then plotted along with our equation for the league average. The Wild’s fitted line is higher on the y-intercept than the fitted line for the league average, $22.76 to be exact. This difference remains constant throughout the entire time period as no random effect of team on year was included in this model, meaning that the rate of change for each team is the same across all teams.